By Sean Wheat from Oberlin Magnet Middle School
OVERVIEW OF LESSON: Students will examine how electricity is generated in North Carolina and around the world, with a focus on using map resources to identify the different types of electrical plants. Focusing on energy and percentages from different sources, students will look at energy usage for North Carolina, and compare that to countries of comparable size (ex. Bangladesh, Tajikistan, Tunisia, Malawi, Nicaragua). We can also expand on this by looking at per capita usage, which will show how the different Sustainable Development Goals are linked. This lesson will link directly to the following UN Sustainable Development Goals: SDG 1: No Poverty, SDG 7: Affordable and Clean Energy, SDG 12: Responsible Consumption and Production, and SDG 15: Life on Land.
SUGGESTED GRADE LEVEL: 6th
SUBJECT: Global Studies
CORRESPONDING NATIONAL AND/OR STATE OF NORTH CAROLINA STANDARDS:
NC ELA and social studies
https://www.dpi.nc.gov/media/11817/open
I.1.3: Analyze details, central ideas, and inferences from sources using discipline-specific strategies.
I.1.4: Assess the credibility of primary and secondary sources using the origin, authority, structure, credibility, reliability, and context of the sources to guide the selection.
6.E.1.2: Explain how quality of life is impacted by economic choices of civilizations, societies and regions.
https://www.dpi.nc.gov/media/7228/open
RI.6.7: Integrate information presented in different media or formats, including visually and quantitatively, as well as in words to develop a coherent understanding of a topic or issue.
SL.6.2: Identify information presented in diverse media and formats that relates to a topic, text, or issue under study.
ESSENTIAL QUESTIONS:
- Where do we get our electricity from in NC?
- What percentage of electricity is from renewable or sustainable sources?
- How does per capita electricity coverage compare to other selected countries?
- What are some reasons for these differences in electricity usage?
LESSON OBJECTIVES:
- Students will be able to research and analyze local and global power generation maps and graphs from international data sources to understand where and how they get their electricity. (These maps contain data on both renewable and nonrenewable power.)
- Students will be able to compare and contrast electricity generation from other countries and link results to per capita usage of electricity.
BACKGROUND INFORMATION FOR THE EDUCATOR or RESOURCES TO EXPLORE FURTHER:
https://www.globalgoals.org/goals/
SPECIFIC STUDENT STRATEGIES & ACTIVITIES:
Day One
- Warm up Questions: Has anyone ever been down by Jordan Lake and seen the towers from the nuclear power plant? What other sources do we get our power from in North Carolina? Is this power a renewable or nonrenewable source, or both? Does everyone understand the difference between renewable and nonrenewable? (oil, coal, natural gas-nonrenewable / wind, solar, hydroelectric-renewable. Nuclear is nonrenewable, but is also clean and sustainable). (5 mins)
- Play video: Energy 101: Electricity Generation. It is a step-by-step process of how we get electricity in our homes. (6 mins)
- Explain watt (a single unit of electric power), kilowatt (1,000 watts), and megawatt (1,000 kW). (1 Mw can power between 400-900 homes) (3 mins)
- The National Energy Institute (NEI) https://www.nei.org/resources/statistics/state-electricity-generation-fuel-shares gives us in NC a breakdown of the different types of electrical power we receive. QUESTION-Which categories are “renewable” sources? Which categories are nonrenewable sources? What percentage do we get from renewable sources? (Review percentages with students). Allow students time to compare NC with other states. (10 mins)
- Where are the different types of electrical facilities in our state? Review the NC State Profile and Energy Estimates from NEI (https://www.eia.gov/state/?sid=NC#tabs-4) with students. Nuclear, coal, solar, hydroelectric, petroleum, and biomass are different types of facilities. Clicking on the different types opens an attachment that tells the type and output in megawatts. Layers can be removed per the drop down in the upper right corner. Have students work in pairs to manipulate and explore the map. (10 mins)
- Pass out Exit Ticket for completion-What source is most common on the map? (Solar/photovoltaic). How many nuclear power plants does NC have and where are they? (3, near Raleigh, Charlotte and Wilmington. Most power sources provide between a couple megawatts to several hundred megawatts of electricity. Which types of plants provide several thousand megawatts? (Steam coal) (10 mins)
Day Two
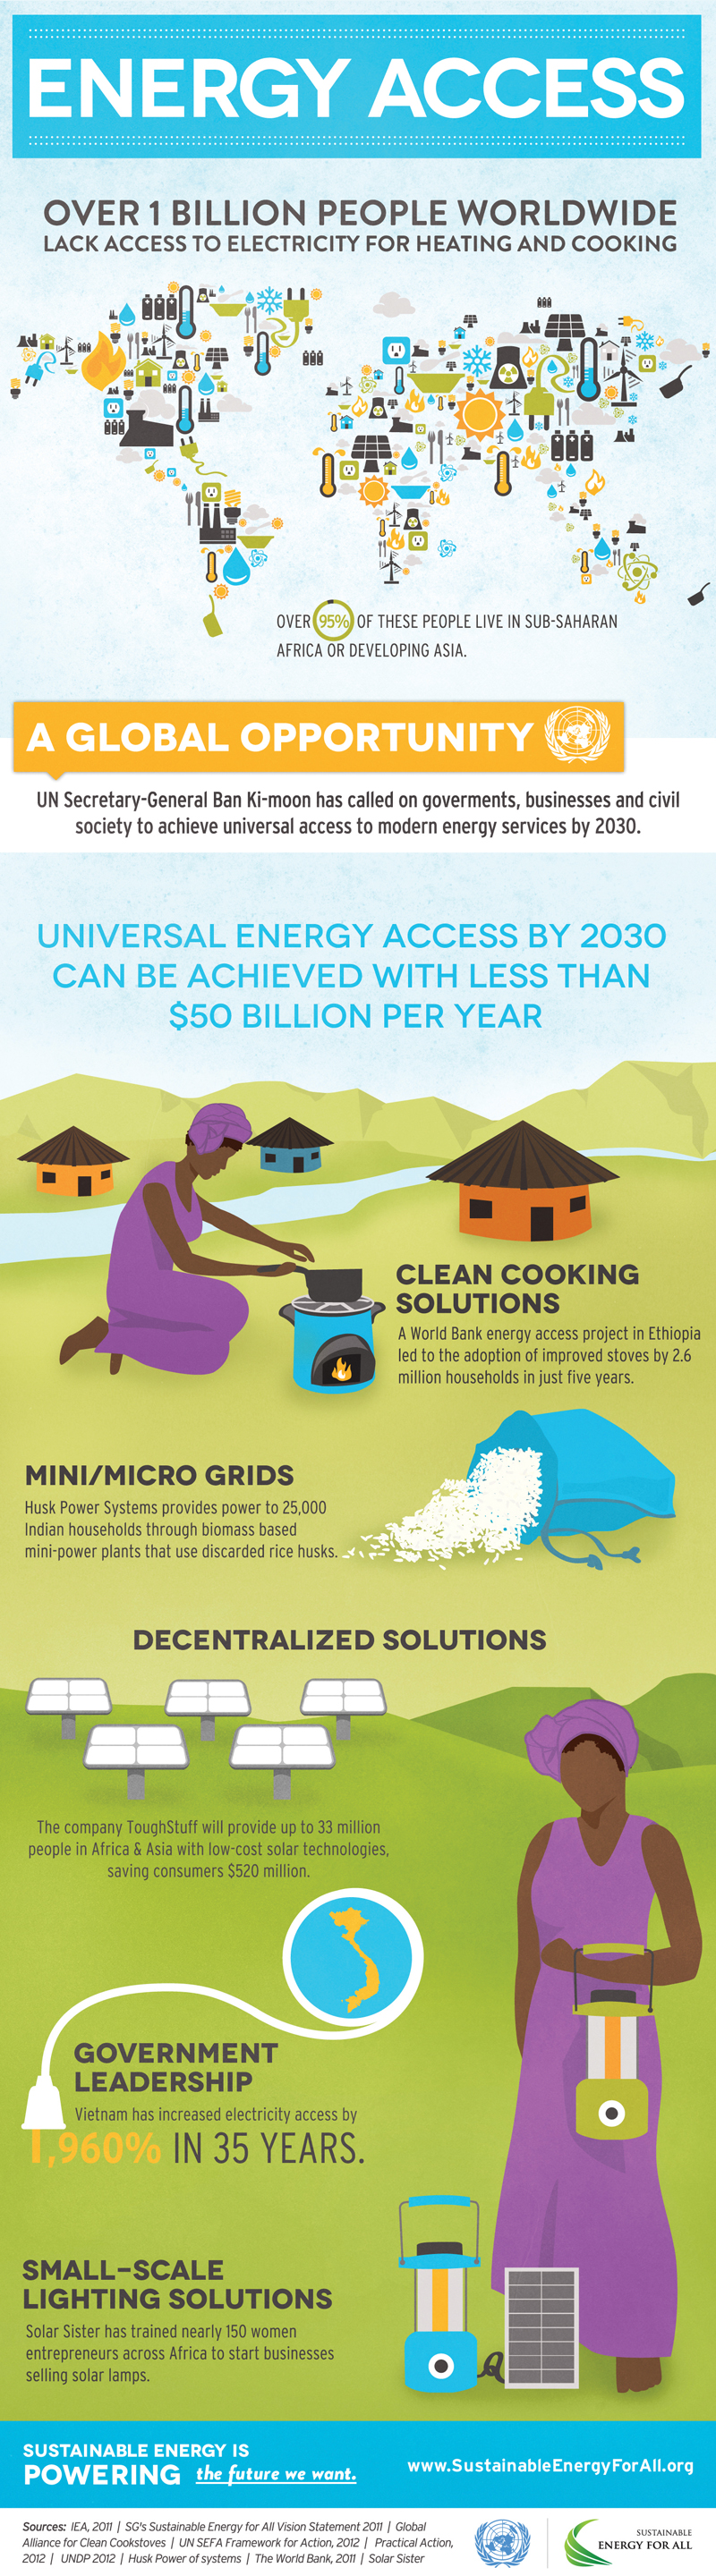
- Warm up: Display and review Energy Access infographic with class. QUESTION: Instead of clean fuels, what do many people burn for heating and cooking? https://images.lemonly.com/wp-content/uploads/2012/06/27141422/United-Nations-Foundation_Access-infographic_web.jpg . (5 mins)
- Write “per capita” on board and explain (the average per person). This is different from “access”, which is about 100% for many countries except those in sub-Saharan Africa. (2 mins)
- Utilizing the link, examine with students per capita usage, how much each person uses annually, in the United States and in countries approximately the same size as North Carolina. (15 mins) https://ourworldindata.org/grapher/per-capita-electricity-generation?tab=chart&country=USA~MWI~NIC~TJK~TUN~BGD
- Have students complete the Per Capita Usage worksheet. (10 mins)
- Explore additional countries by adding/removing countries in the link. (10 mins)
Days Three / Four
- Working in pairs and utilizing Canva (or another design program) have students create their own infographic incorporating information learned during the lesson. [Canva has some free infographic templates available in the education section of its website.] The Infographic should include:
1) renewable/nonrenewable energy sources in NC
2) percentage of energy from different sources
3) a brief step-by-step of how we get power in our homes
4) a comparison of per capita energy use in the United States and 4 other countries
ASSESSMENTS: Exit Ticket, Student Handout, Infographic
LEARNING EXTENSIONS:
Field Trip to a power plant. Places like the Harris Energy & Environmental Center allow for tours.
MATERIALS:
Per Capita Electricity Usage worksheet
REFERENCES:
energynownews. (2011, October 3). Energy 101: Electricity Generation [Video]. YouTube. https://www.youtube.com/watch?v=20Vb6hlLQSg
Energy Information Administration. State Profile and Energy Estimates. U.S. Energy Information Institute. https://www.eia.gov/state/?sid=NC#tabs-4
Global Change Data Lab. (2021). Per Capita Electricity Generation. https://ourworldindata.org/grapher/per-capita-electricity-generation?tab=chart&country=USA~MWI~NIC~TJK~TUN~BGD
Nuclear Energy Institute. (2021) State Electricity Generation Fuel Shares. https://www.nei.org/resources/statistics/state-electricity-generation-fuel-shares
United Nations. (2012). Energy Access [Infographic]. United Nations. https://images.lemonly.com/wp-content/uploads/2012/06/27141422/United-Nations-Foundation_Access-infographic_web.jpg